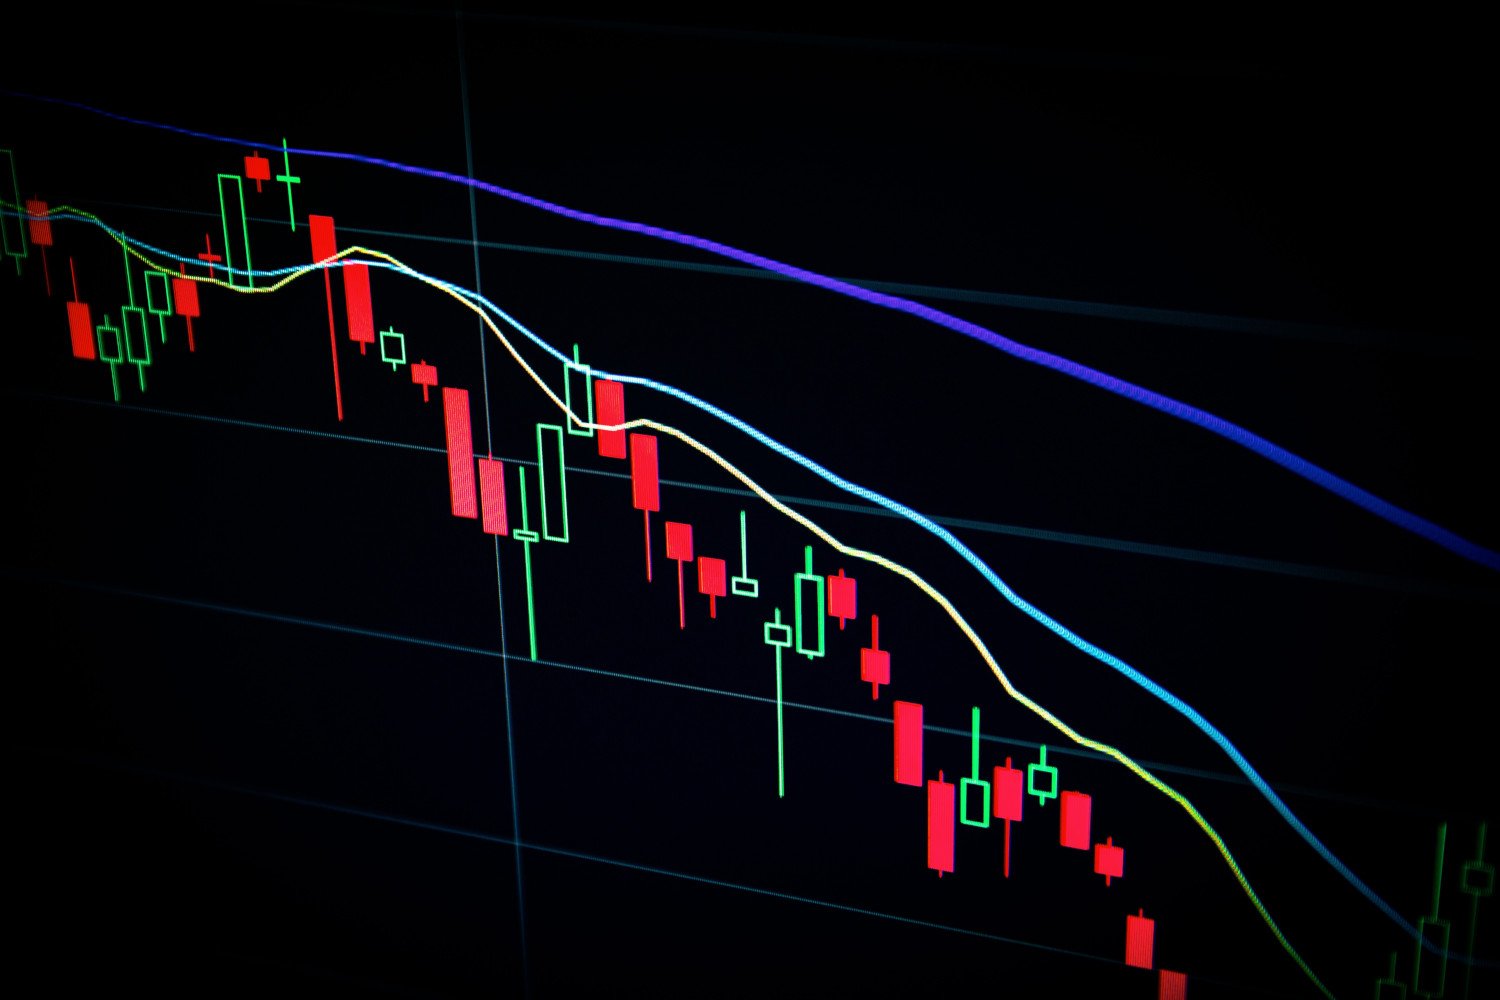
In the world of trading, technical analysis is a key component of successful decision-making. Among the vast array of tools available, moving averages stand out as one of the most popular indicators. Moving averages help traders smooth out price data, identify trends, and make more informed trading decisions. This article will explore the mechanics behind moving averages, the different types, and the strategies traders use to leverage them in real-world market conditions.

What Are Moving Averages?
At its core, a moving average (MA) is a simple mathematical calculation that takes the average of a specific set of prices over a given period. This average “moves” because it continually recalculates as new prices are introduced. Moving averages allow traders to filter out the noise of daily market fluctuations and get a clearer sense of a security’s overall trend.
There are two main types of moving averages: the Simple Moving Average (SMA) and the Exponential Moving Average (EMA). An SMA gives equal weight to all data points, while the EMA gives more weight to recent prices, making it more responsive to new market data. Both have their place in technical analysis, but knowing when and how to use each can make a significant difference in trading success. To get started, get more info here.
Types of Moving Averages
The Simple Moving Average is the most basic form of moving average. Calculated by taking the sum of a set of prices over a defined period and dividing by the number of periods, it provides an unweighted average. SMAs are often used by long-term traders to gauge overall market direction. However, because all prices are treated equally, SMAs may lag in fast-moving markets.
The Exponential Moving Average (EMA) is favoured by short-term traders due to its focus on recent price activity. By giving more weight to the most recent prices, the EMA reacts more quickly to changes, making it a preferred tool for traders seeking to identify entry and exit points in volatile markets. A lesser-known type of moving average is the Weighted Moving Average (WMA). Like the EMA, it assigns greater importance to recent prices, but the weighting is more pronounced. This makes the WMA even more sensitive to price shifts, though its use tends to be more niche, often employed in specific scenarios like rapid market turnarounds.
Another variation is the Smoothed Moving Average (SMMA), which incorporates more data into its calculation to reduce volatility over time. Traders looking to hold positions over longer periods sometimes turn to SMMAs to capture the bigger picture while avoiding the short-term noise that affects other types of moving averages.
Key Moving Average Strategies
One of the most well-known strategies involving moving averages is the crossover strategy. In this method, traders use two moving averages, typically a short-term and a long-term MA. The crossover occurs when the short-term MA crosses above or below the long-term MA. A “Golden Cross,” where the short-term MA crosses above the long-term MA, signals a potential bullish market, while a “Death Cross,” where the short-term MA falls below the long-term MA, indicates bearish conditions. This strategy helps traders spot potential trend reversals and determine market sentiment.
Another important strategy is using moving averages to identify support and resistance levels. Moving averages can act as dynamic support and resistance zones, particularly in trending markets. Traders often place their buy or sell orders near these levels, expecting the price to bounce back in the direction of the prevailing trend.
Finally, moving averages can play a role in mean reversion strategies. This approach is based on the assumption that prices will revert to their mean or average after deviating from it for a period. By combining moving averages with other indicators like oscillators, traders can spot overbought or oversold conditions and prepare for potential reversals.
Time Frames and Moving Average Settings
Moving averages can be customised to fit any time frame, making them versatile tools for day traders, swing traders, and long-term investors alike. For day traders, shorter time frames such as the 9-day or 21-day EMA are often preferred due to their sensitivity to recent price action. Swing traders, on the other hand, may rely on the 50-day or 100-day moving averages to capture intermediate trends and hold positions for several days or weeks.
Long-term traders often turn to the 200-day moving average. Considered one of the most important moving averages, it is used to identify long-term trends and provide an overall market outlook. If the price is above the 200-day MA, the market is generally seen as bullish, whereas if it’s below, the market is considered bearish.
Selecting the right moving average depends on your trading style and the time horizon you are working with. Experimenting with different settings and backtesting strategies is key to finding what works best for you.
Conclusion
Moving averages are one of the most widely used trading indicators for a reason. They provide valuable insight into market trends, offer clear entry and exit signals, and can be easily integrated into various trading strategies. However, like all indicators, they work best when used alongside other forms of analysis and in the context of a broader trading plan. Mastering the use of moving averages can significantly enhance your trading performance, but it requires practice, discipline, and a clear understanding of the market you’re operating in.


